They are closely linked; the more income a household has, the greater the capacity for building wealth over time
Income
Most households have more than one source of private income
Wages
Salaries
Investment
Pension
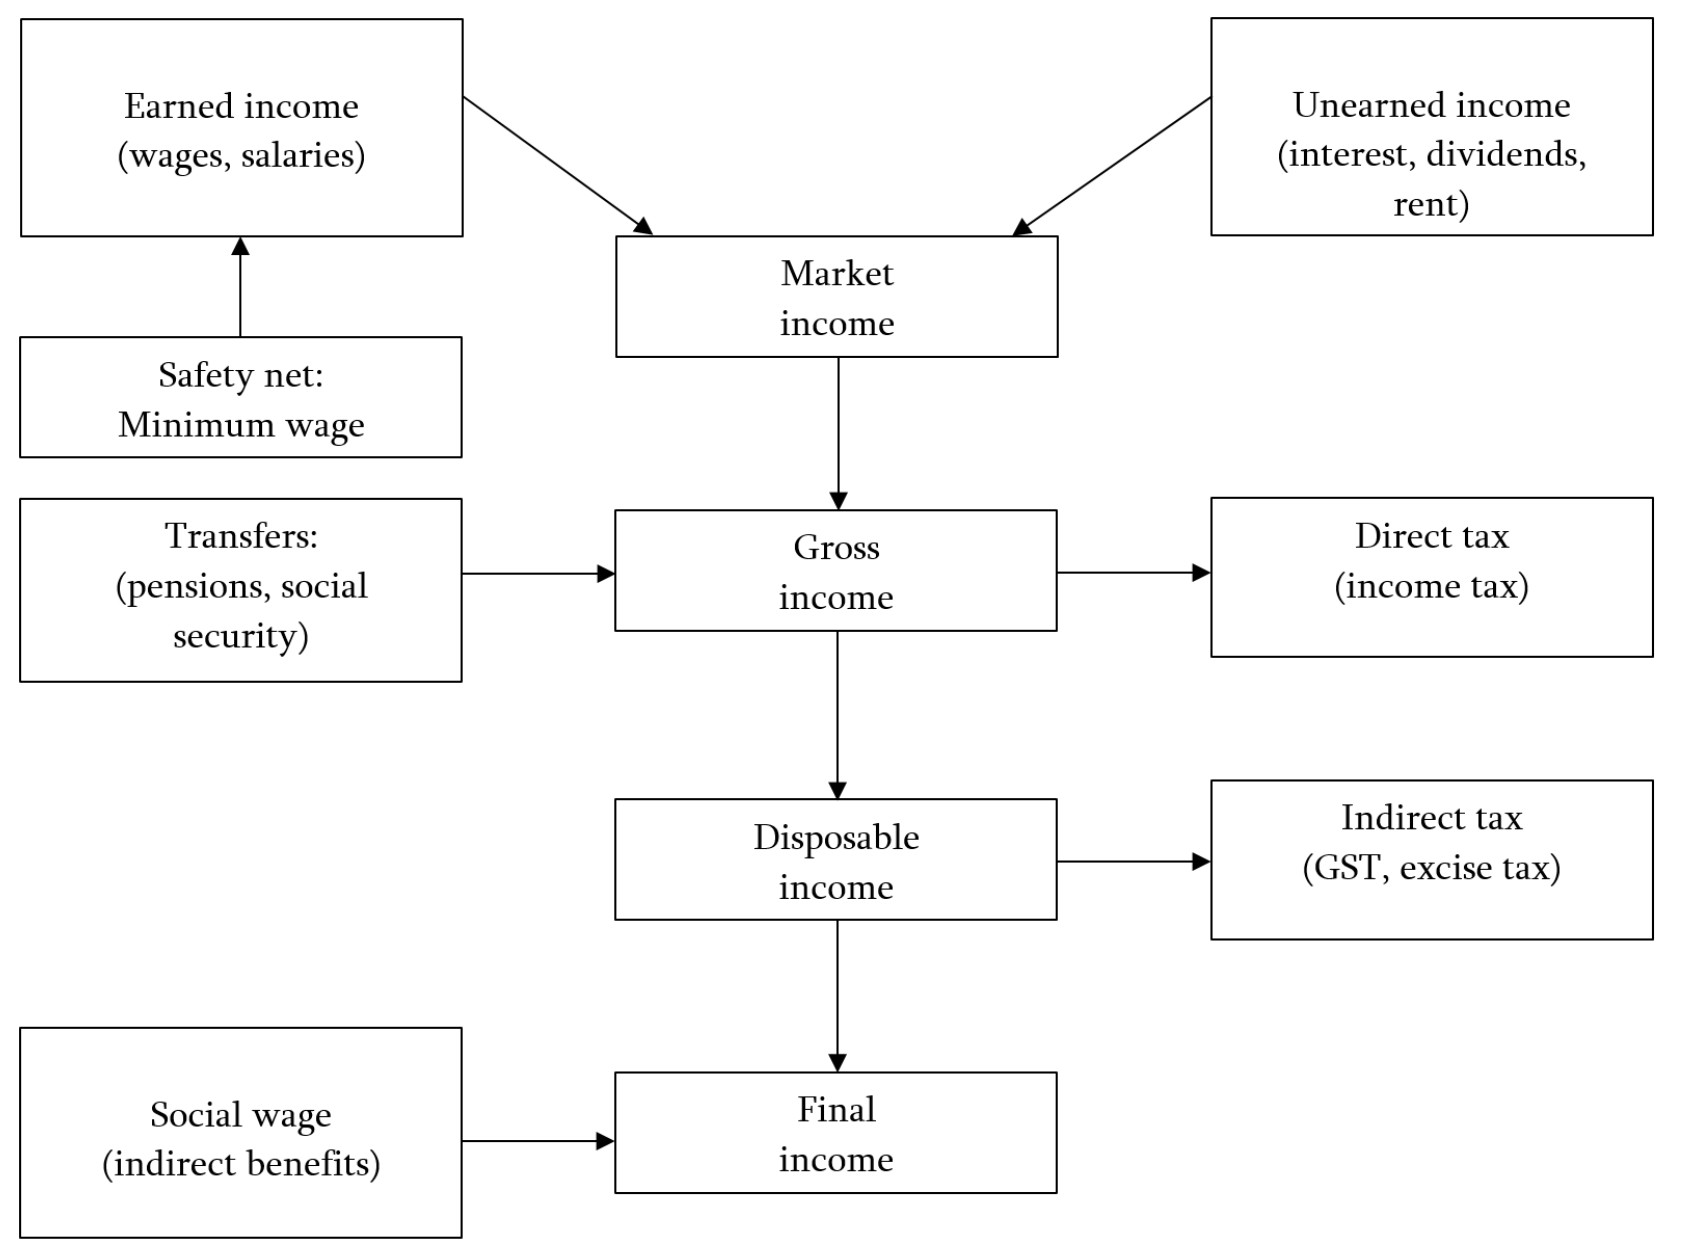
Gross income is determined by adding any transfers a household receives from government e.g. pension
Direct taxes are deducted to determine disposable income
Gross income is before taxes, disposable income is after taxes
Most households also receive some form of indirect benefit (social transfers) such as assistance with school fees or healthcare costs, which add to final income
Purchasing Power of Individuals
Minimum Wage and Transfers
Some peoples’ pay is influenced by minimum wages or awards rather than by free negotiations between employer and employee.
In Australia, for example, the minimum wage is set by Fair Pay Australia and is altered from time to time.
Eligible people may receive transfers from the government, for example as pensions or benefits if they are unemployed, are over pension age or have young families.
Income Tax
Income, after an allowance for transfers, is known as Gross Income.
Households pay income tax on their gross income.
The income that remains after payment of direct tax is known as disposable income.
The Australian income tax is progressive, meaning that people on higher incomes are taxed at a proportionately higher rate than people on low incomes.
Social Wage
The final purchasing power or value of households’ income is subject to two further adjustments.
(First), the government provides a number of things at no or low cost to households, for example, government schooling, healthcare through Medicare, use of most roads, libraries and so on.
The value of these products can be considered to be a form of social wage and in effect raises the purchasing power of peoples’ disposable incomes.
Indirect Tax
(Second), the government also collects revenue from indirect taxes like GST and excise duty.
These taxes are levied when people spend money or undertake certain activities.
These indirect taxes reduce the purchasing power of disposable incomes.
Wealth
The current value of the assets a household has accumulated over time through savings; financial investments, business profits, inheritance
The Australian Bureau of Statistics (ABS) defines wealth as the difference between a household’s assets (what you own) and its liabilities (what you owe)
If liabilities exceed assets, you are in debt
Household assets are generally held as property, shares, savings and superannuation, while liabilities include mortgages, personal loans, and credit card debt
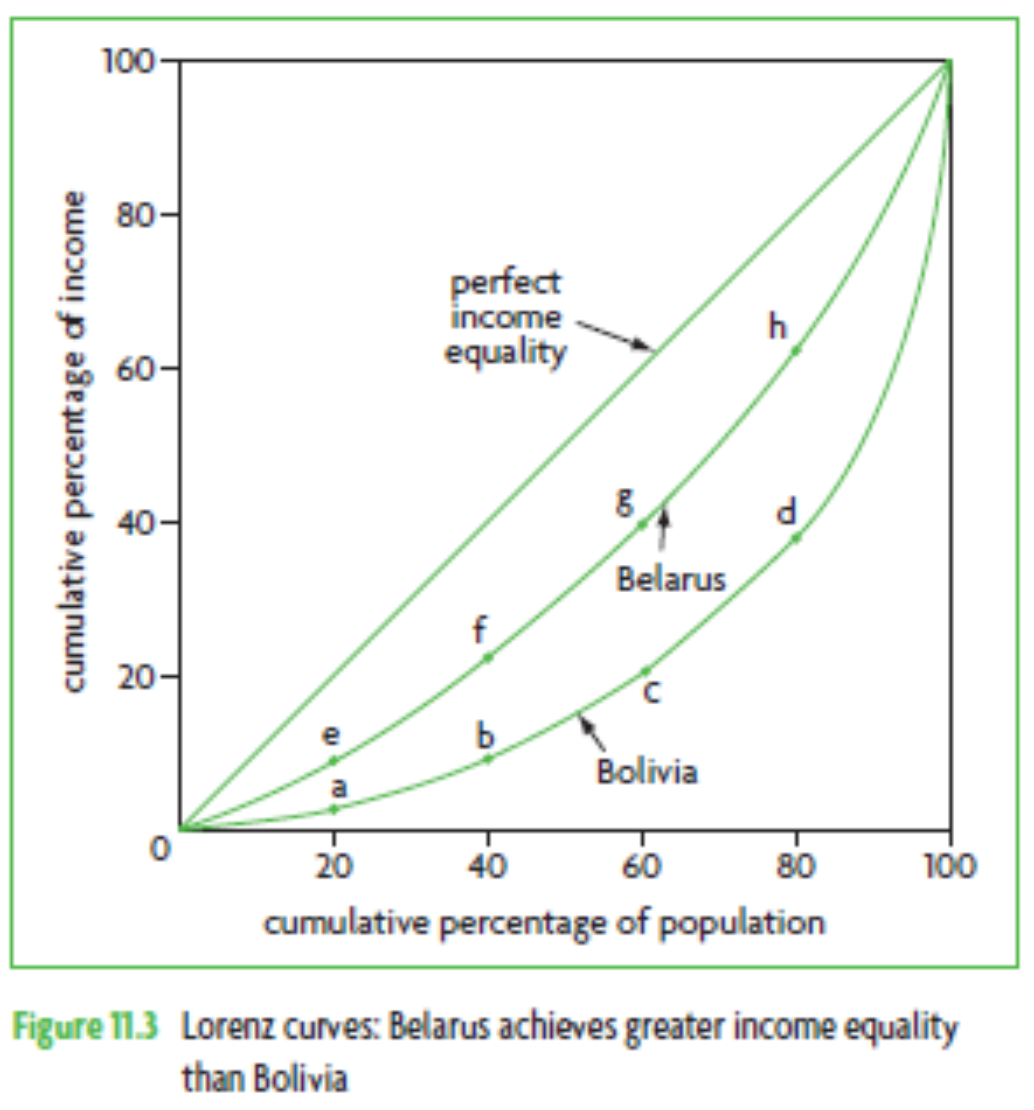
The Lorenz Curve
A Lorenz curve is used to show the degree of income inequality in an economy.
Named after an American statistician, Conrad Lorenz, who devised this measure of income inequality in 1905, it is a visual representation of income distribution.
The Curve shows the percentage of income received by different sections of the population.
To construct a Lorenz curve, we draw a square box, as in the figure.
Both axes show cumulative data, that is, totals that have been added together. For example, the level of income at 40% is the total share of income received by the lowest 40% of the population added together.
A Lorenz curve, therefore, must start at the origin (no people = no income) and finish in the top right corner (all income must be received by someone)
The vertical axis measures the total amount of income in an economy in cumulative percentages (therefore it runs from 0 to 100%)
The horizontal axis plots the total population in the economy, also in cumulative percentages (therefore this, too, runs from 0 to 100%).
(‘Cumulative’ means that 20 represents the poorest 20% of the population, 40 represents the poorest 40%, and so on.)
Income Distribution
The Lorenz Curve
The population is ranked according to their income, from the lowest to the highest income.
If everybody received the same income the Lorenz Curve would be a straight, diagonal line, running from the origin to the top right of the diagram.
This is called the line of equality.
The more the curve dips away from the line of equality the more uneven is the distribution of income.
The diagonal line in the diagram represents perfect equality in income distribution, as it shows that if income were perfectly equally distributed, 20% of the population would received 20% of income, 40% would receive 40% of income, and so on.
The Lorenz curve plots the actual relationship between percentages of the population and the shares of income they receive.
The Gini coefficient is a measure that indicates the degree of curvature or concavity of the line.
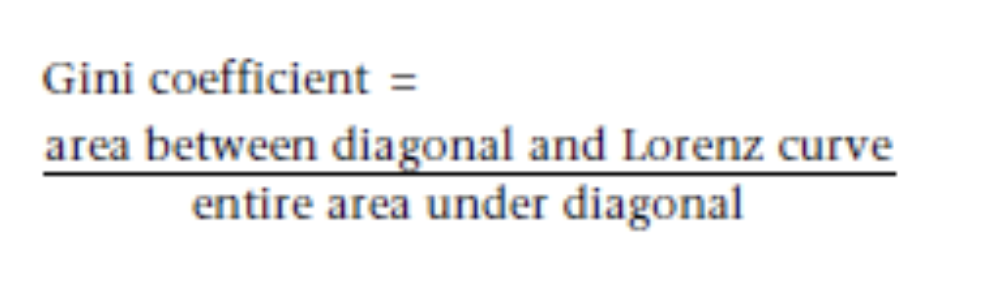
The Gini Coefficient
The Gini coefficient (named after Corrado Gini, an Italian statistician) is a summary measure of the information contained in the Lorenz curve of an economy.
It is expressed as:
If there were perfect income equality, the coefficient would be zero, since the numerator of the ratio would be zero.
The Gini coefficient is a summary measure of income inequality, and in a Lorenz diagram is the ratio of the area between the diagonal and the Lorenz curve, to the total area under the diagonal.
It has a value between 0 and 1;
The closer the value is to 0, the greater the income equality; the closer the value is to 1, the greater the income inequality.
The closer it is to 1 (larger Gini), the greater is the income inequality, since the further away is the Lorenz curve from the diagonal.
A perfectly unequal income distribution would be where a single household receives all the income of the economy, and the numerator would be equal to the entire area under the diagonal, making the Gini coefficient equal to 1.